The Spooky Quad Week
Quadruple witching, occurs on the third Friday of the month of every quarter, in March, June, September, and December, and refers to the simultaneous expiration of single-stock options, single-stock futures, and stock-index options and stock-index futures.
Stock index futures: Nasdaq, Dow Jones Industrial Average, S&P 500 and Russell 2000 will fully transition from the September contract to the December on Friday September 17.
Options volumes tend to be particularly elevated during quad-witching periods, which may also account for some of the choppiness associated with September as the worst-performing month for indices in general.
Quad witching usually only results in higher than normal volumes, and those usually peak on Wednesday or Thursday of the expiration week.
Options volume typically spikes around 3:30 p.m. Eastern Time on quadruple-witching days, but it remains to be seen on how that will play out in reality on Friday.
Historically, quad witching hasn’t been particularly characterized as a high momentum day not week. The S&P 500 index, for example, has a daily average gain of 0.04% since the first quad witching in 2002, according to Dow Jones Market Data.
The Volatility Index VIX (the fear gauge) – reflects bullish and bearish options bets on the S&P 500 in the coming 30 days, and tends to rise as stocks fall as investors turn to options to hedge against market downturns, has seen muted moves.
So how does this translate into the market and how to trade it?
Right before the quad week begins the price tends to remain range bound. As volatility increased mid week price tends to SHAKE.
For example if an index in into an uptrend during the quad week – it will tend to base, remain range bound for a few days and as it is getting closer to expiration then it pulls back into a prior resistance level, usually testing higher time frame support.
And this is not valid for QUAD week but for any options expiration in general….
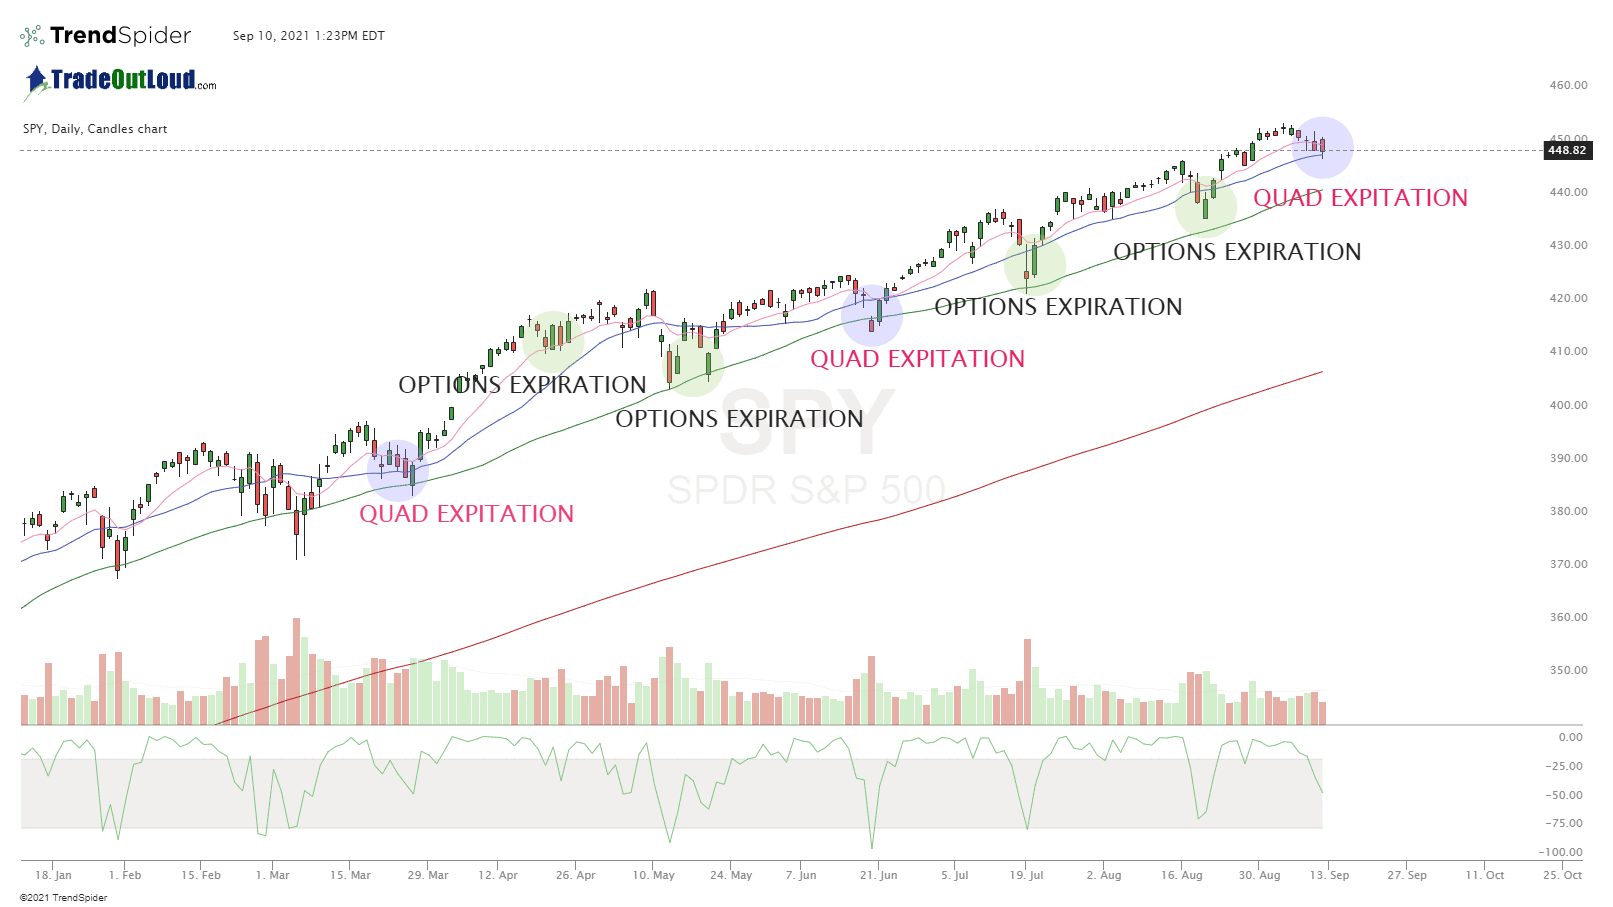
So can we determine a pullback area with approximation? Yes and no. Every day, week and month is different in the market but based on price action, a few simple indicators and symmetry we can assume that pullback are likely repetitive based on price memory. If we look at the chart below of the SPY we can see that since January 2021 it tested and retested the 50 SMA on the Daily chart before rotating back to the upside and continuing the trend.

Also note that the weekly in 2021 (since January) has followed the 10 EMA rigorously.
So can we expect a test to the 10 EMA? Likely – SPY $443.00 area on watch.
Click the link below to zoom in.
